This page was generated by
nbsphinx from
docs/notebooks/dispersion/dispersion_function.ipynb.
Interactive online version:
![]() .
.
[1]:
%matplotlib inline
The plasma dispersion function
Let’s import some basics (and plasmapy!)
[2]:
import matplotlib.pyplot as plt
import numpy as np
[3]:
Take a look at the docs to plasma_dispersion_func() for more information on this.
We’ll now make some sample data to visualize the dispersion function:
[4]:
x = np.linspace(-1, 1, 200)
X, Y = np.meshgrid(x, x)
Z = X + 1j * Y
print(Z.shape)
(200, 200)
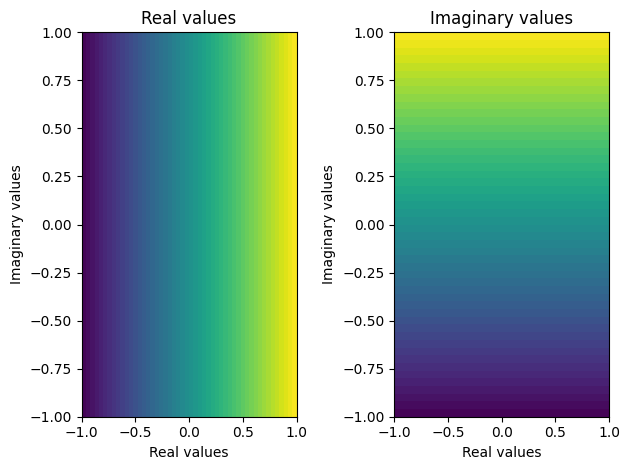
Before we start plotting, let’s make a visualization function first:
[5]:
def plot_complex(X, Y, Z, N=50):
fig, (real_axis, imag_axis) = plt.subplots(1, 2)
real_axis.contourf(X, Y, Z.real, N)
imag_axis.contourf(X, Y, Z.imag, N)
real_axis.set_title("Real values")
imag_axis.set_title("Imaginary values")
for ax in [real_axis, imag_axis]:
ax.set_xlabel("Real values")
ax.set_ylabel("Imaginary values")
fig.tight_layout()
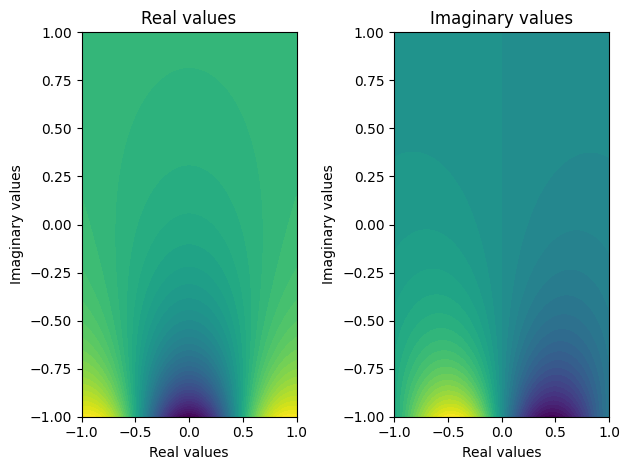
plot_complex(X, Y, Z)
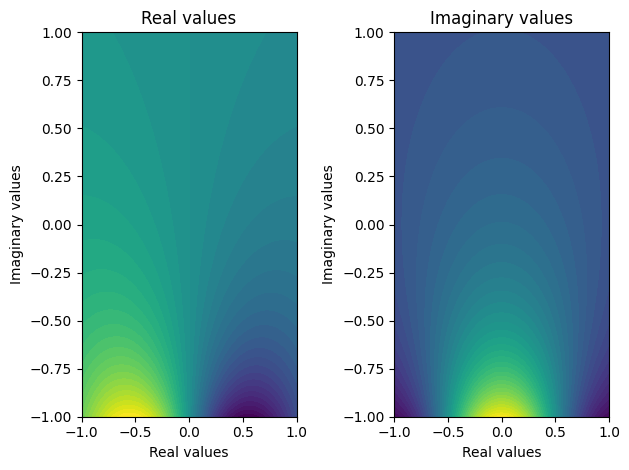
We can now apply our visualization function to our simple dispersion relation
[6]:
# sphinx_gallery_thumbnail_number = 2
F = plasma_dispersion_func(Z)
plot_complex(X, Y, F)
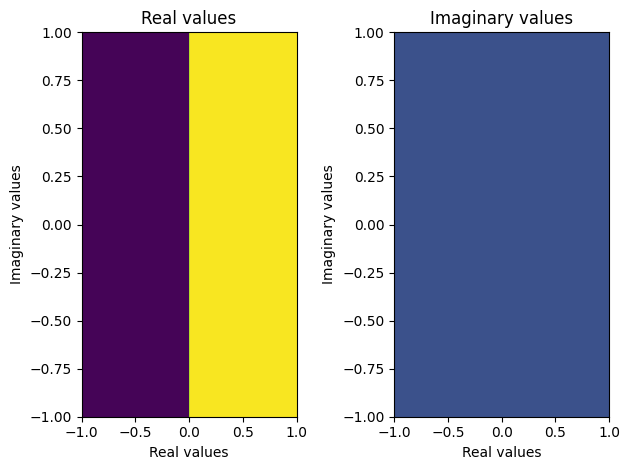
Let’s find the area where the dispersion function has a lesser than zero real part:
[7]:
plot_complex(X, Y, F.real < 0)
We can visualize the derivative:
[8]:
F = plasma_dispersion_func_deriv(Z)
plot_complex(X, Y, F)
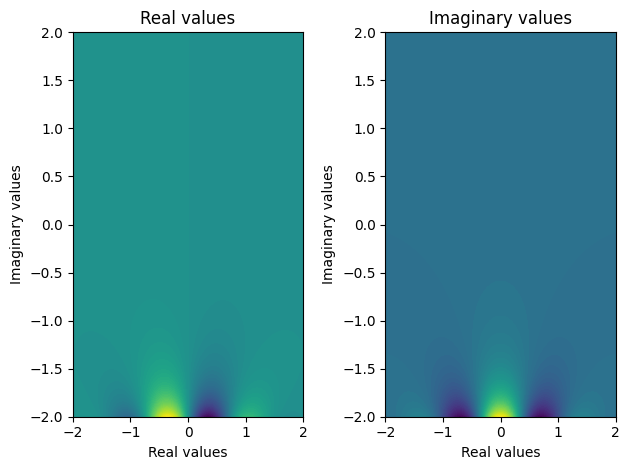
Plotting the same function on a larger area:
[9]:
x = np.linspace(-2, 2, 400)
X, Y = np.meshgrid(x, x)
Z = X + 1j * Y
print(Z.shape)
(400, 400)
[10]:
F = plasma_dispersion_func(Z)
plot_complex(X, Y, F, 100)
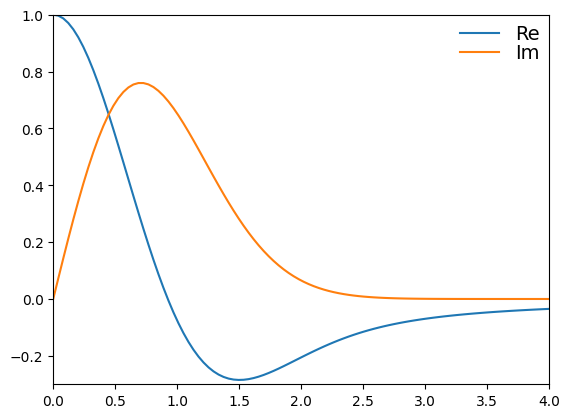
Now we examine the derivative of the dispersion function as a function of the phase velocity of an electromagnetic wave propagating through the plasma. This is recreating figure 5.1 in J. Sheffield, D. Froula, S. H. Glenzer, and N. C. Luhmann Jr, Plasma scattering of electromagnetic radiation: theory and measurement techniques, ch. 5, p. 106 (Academic press, 2010).
[11]:
xs = np.linspace(0, 4, 100)
ws = (-1 / 2) * plasma_dispersion_func_deriv(xs)
wRe = np.real(ws)
wIm = np.imag(ws)

plt.plot(xs, wRe, label="Re")
plt.plot(xs, wIm, label="Im")
plt.axis([0, 4, -0.3, 1])
plt.legend(
    loc="upper right", frameon=False, labelspacing=0.001, fontsize=14, borderaxespad=0.1
)
plt.show()