This page was generated by
nbsphinx from
docs/notebooks/formulary/thermal_speed.ipynb.
Interactive online version:
![]() .
.
Thermal Speed
[1]:
%matplotlib inline

import astropy.units as u
import matplotlib.pyplot as plt
import numpy as np

from plasmapy.formulary import (
    Maxwellian_speed_1D,
    Maxwellian_speed_2D,
    Maxwellian_speed_3D,
)
from plasmapy.formulary.speeds import thermal_speed
The thermal_speed function can be used to calculate the thermal velocity for a Maxwellian velocity distribution. There are three common definitions of the thermal velocity, which can be selected using the “method” keyword, which are defined for a 3D velocity distribution as
‘most_probable’ \(v_{th} = \sqrt{\frac{2 k_B T}{m}}\)
‘rms’ \(v_{th} = \sqrt{\frac{3 k_B T}{m}}\)
‘mean_magnitude’ \(v_{th} = \sqrt{\frac{8 k_B T}{m\pi}}\)
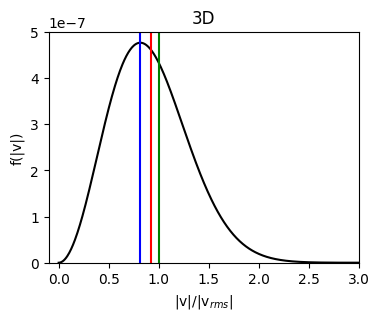
The differences between these velocities can be seen by plotitng them on a 3D Maxwellian speed distribution
[2]:
T = 1e5 * u.K
speeds = np.linspace(0, 8e6, num=600) * u.m / u.s

pdf_3D = Maxwellian_speed_3D(speeds, T=T, particle="e-")

fig, ax = plt.subplots(figsize=(4, 3))

v_most_prob = thermal_speed(T=T, particle="e-", method="most_probable", ndim=3)
v_rms = thermal_speed(T=T, particle="e-", method="rms", ndim=3)
v_mean_magnitude = thermal_speed(T=T, particle="e-", method="mean_magnitude", ndim=3)

ax.plot(speeds / v_rms, pdf_3D, color="black", label="Maxwellian")

ax.axvline(x=v_most_prob / v_rms, color="blue", label="Most Probable")
ax.axvline(x=v_rms / v_rms, color="green", label="RMS")
ax.axvline(x=v_mean_magnitude / v_rms, color="red", label="Mean Magnitude")

ax.set_xlim(-0.1, 3)
ax.set_ylim(0, None)
ax.set_title("3D")
ax.set_xlabel("|v|/|v$_{rms}|$")
ax.set_ylabel("f(|v|)")
[2]:
Text(0, 0.5, 'f(|v|)')
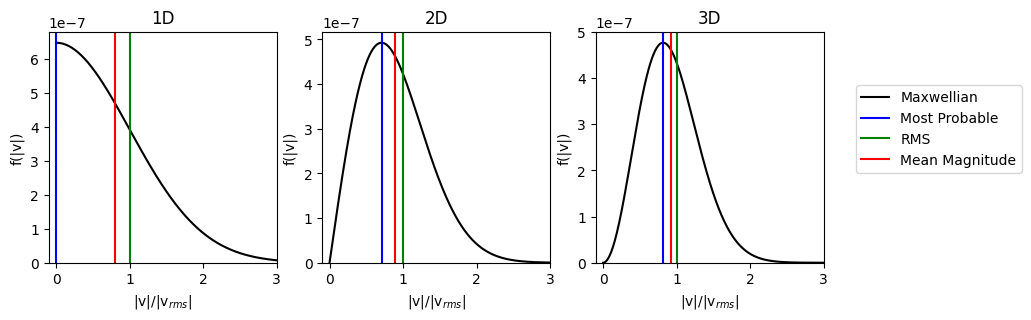
Similar speeds are defined for 1D and 2D distributions. The differences between these definitions can be illustrated by plotting them on their respective Maxwellian speed distributions.
[3]:
pdf_1D = Maxwellian_speed_1D(speeds, T=T, particle="e-")
pdf_2D = Maxwellian_speed_2D(speeds, T=T, particle="e-")

dim = [1, 2, 3]
pdfs = [pdf_1D, pdf_2D, pdf_3D]

plt.tight_layout()
fig, ax = plt.subplots(ncols=3, figsize=(10, 3))

for n, pdf in enumerate(pdfs):
    ndim = n + 1
    v_most_prob = thermal_speed(T=T, particle="e-", method="most_probable", ndim=ndim)
    v_rms = thermal_speed(T=T, particle="e-", method="rms", ndim=ndim)
    v_mean_magnitude = thermal_speed(
        T=T, particle="e-", method="mean_magnitude", ndim=ndim
    )

    ax[n].plot(speeds / v_rms, pdf, color="black", label="Maxwellian")

    ax[n].axvline(x=v_most_prob / v_rms, color="blue", label="Most Probable")
    ax[n].axvline(x=v_rms / v_rms, color="green", label="RMS")
    ax[n].axvline(x=v_mean_magnitude / v_rms, color="red", label="Mean Magnitude")

    ax[n].set_xlim(-0.1, 3)
    ax[n].set_ylim(0, None)
    ax[n].set_title(f"{ndim:d}D")
    ax[n].set_xlabel("|v|/|v$_{rms}|$")
    ax[n].set_ylabel("f(|v|)")


ax[2].legend(bbox_to_anchor=(1.9, 0.8), loc="upper right")
[3]:
<matplotlib.legend.Legend at 0x737145d61010>
<Figure size 640x480 with 0 Axes>